6.12 Rendering and Visualizations
An ArtiSynth FEM model can be rendered in a wide variety of ways, by adjusting the rendering of its nodes, elements, meshes (including the surface and other embedded meshes), and, for FemMuscleModel, muscle bundles. Properties for controlling the rendering include both the standard RenderProps (Section 4.3) as well as more specific properties. These can be set either in code, as described below, or by selecting the desired components (or their lists) and then choosing either Edit render props ... (for standard render properties) or Edit properties ... (for component-specific render properties) from the context menu. As mentioned in Section 4.3, standard render properties are inherited, and so if not explicitly specified within a given component, will assume whatever value has been set in the nearest ancestor component, or their default value. Some component-specific render properties are inherited as well.
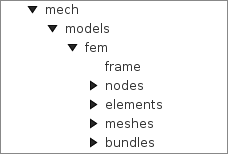
One very direct way to control the rendering is to control the visibility of the various component lists. This can be done by selecting them in the navigation panel (Figure 6.18) and then choosing “Set invisible” or “Set visible”, as appropriate. It can also be done in code, as shown in the fragment below making the elements and nodes of an FEM model invisible:
6.12.1 Nodes
Node rendering is controlled by the point render properties of the standard RenderProps. By default, nodes are set to render as gray points one pixel wide, and so are not highly visible. To increase their visibility, and make them easier to select in the viewer, one can make them appear as spheres of a specified radius and color. In code, this can be done using the RenderProps.setSphericalPoints() method, as in this example,
which sets the default rendering for all points within the FEM model (which includes the nodes) to be green spheres of radius 0.01. To restrict this to the node list specifically, one could supply fem.getNodes() instead of fem to setSphericalPoints().
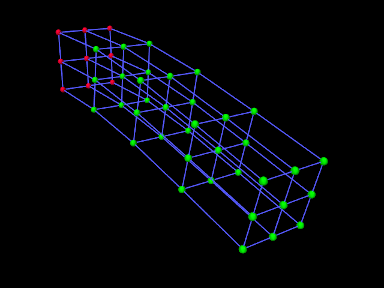
It is also possible to set render properties for individual nodes. For instance, one may wish to mark nodes that are non-dynamic using a different color:
Figure 6.19 shows an FEM model with nodes rendered as spheres, with the dynamic nodes colored green and the non-dynamic ones red.
6.12.2 Elements
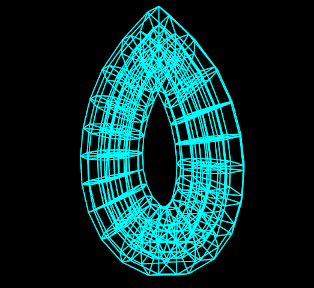
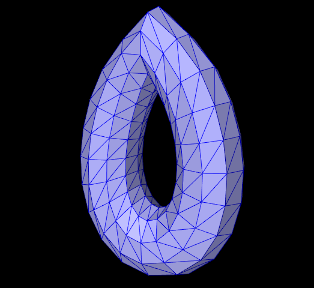
By default, elements are rendered as wireframe outlines, using the lineColor and lineWidth properties of the standard render properties, with defaults of “gray” and 1. To improve visibility, one may wish the change the line color or size, as illustrated by the following fragment:
This will set the default line color and width for all components within the FEM model. To restrict this to the elements only, one can specify fem.getElements() (and/or fem.getShellElements()) to the set methods. The fragment above is illustrated in Figure 6.20 (left) for a model created with a call to FemFactory.createHexTorus().
|
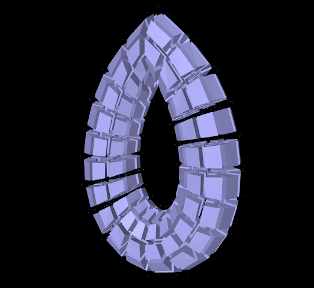
Elements can also be rendered as widgets that depict an approximation
of their shape displayed at some fraction of the element’s size (this
shape will be 3D for volumetric elements and 2D for shell
elements). This is controlled using the FemModel3d property elementWidgetSize, which is restricted to the range ![]() and
describes the size of the widgets relative to the element size. If
elementWidgetSize is 0 then no widgets are displayed. The
widget color is controlled using the faceColor and alpha
properties of the standard render properties. The following code
fragment enables element widget rendering for an FEM model, as
illustrated in Figure 6.20 (right):
and
describes the size of the widgets relative to the element size. If
elementWidgetSize is 0 then no widgets are displayed. The
widget color is controlled using the faceColor and alpha
properties of the standard render properties. The following code
fragment enables element widget rendering for an FEM model, as
illustrated in Figure 6.20 (right):
Since setting faceColor for the whole FEM model will also set the default face color for its meshes, one may wish to restrict setting this to the elements only, by specifying fem.getElements() and/or fem.getShellElements() to setFaceColor().
Element widgets can provide a easy way to select specific elements. The elementWidgetSize property is also present as an inherited property in the volumetric and shell element lists (elements and shellElements), as well as individual elements, and so widget rendering can be controlled on a per-element basis.
6.12.3 Surface and other meshes
|
A FEM model can also be rendered using its surface mesh and/or other mesh geometry (Section 6.20). How meshes are rendered is controlled by the property surfaceRendering, which can be assigned any of the values shown in Table 6.5. The value None causes nothing to be rendered, while Shaded causes a mesh to be rendered using the standard rendering properties appropriate to that mesh. For polygonal meshes (which include the surface mesh), this will be done according to the face rendering properties in same way as for rigid bodies (Section 3.2.8). These properties include faceColor, shading, alpha, faceStyle, drawEdges, edgeWidth, and edgeColor (or lineColor if the former is not set). The following code fragment sets an FEM surface to be rendered with blue-gray faces and dark blue edges (Figure 6.21, left):
| Value | Description |
|---|---|
| None | mesh is not rendered |
| Shaded | rendered as a mesh using the standard rendering properties |
| Stress | color map of the von Mises stress |
| Strain | color map of the von Mises strain |
| MAPStress | color map of the maximum absolute value principal stress |
| MAPStrain | color map of the maximum absolute value principal strain |
| MaxShearStress | color map of the maximum shear stress |
| MaxShearStrain | color map of the maximum shear strain |
| EnergyDensity | color map of the strain energy density |
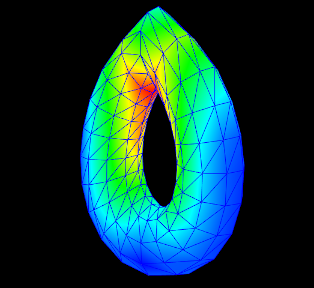
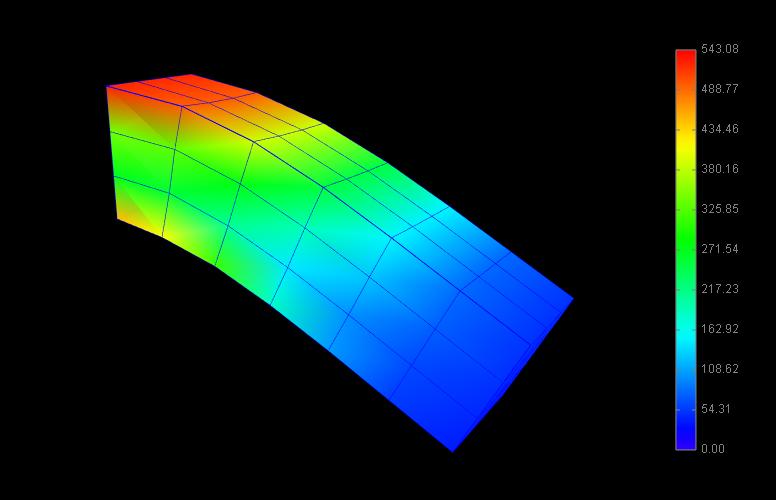
Other values of surfaceRendering cause polygonal meshes to be displayed as a color map showing the various stress or strain measures shown in Table 6.5 and described in greater detail in Section 6.11.2. The fragment below sets an FEM surface to be rendered to show the von Mises stress (Figure 6.21, right), while also rendering the edges as dark blue:
The color maps used in stress/strain rendering are controlled using the following additional properties:
- stressPlotRange
-
The range of numeric values associated with the color map. These are either fixed or updated automatically, according to the property stressPlotRanging. Values outside the range are truncated.
- stressPlotRanging
-
Describes if and how stressPlotRange is updated:
- Fixed
-
Range does not change and should be set by the application.
- Auto
-
Range automatically expands to contain the most recently computed values. Note that this does not cause the range to contract.
- colorMap
-
Value is a delegate object that converts stress and strain values to colors. Various types of maps exist, including HueColorMap (the default), GreyscaleColorMap, RainbowColorMap, and JetColorMap. These all implement the ColorMap interface.
All of these properties are inherited and exported both by FemModel3d and the individual mesh components (which are instances of FemMeshComp), allowing mesh rendering to be controlled on a per-mesh basis.
6.12.4 FEM-based muscles
FemMuscleModel and its subcomponents MuscleBundle export additional properties to control the rendering of muscle bundles and their associated fibre directions. These include:
- directionRenderLen
-
A scalar in the range
![[0,1]](mi/mi2248.png) , which if
, which if  causes the fibre
directions to be rendered within the elements associated with a MuscleBundle (Section 6.9.3). The directions
are rendered as line segments, controlled by the standard line
render properties lineColor and lineWidth, and the value
of directionRenderLen specifies the length of this segment
relative to the size of the element.
causes the fibre
directions to be rendered within the elements associated with a MuscleBundle (Section 6.9.3). The directions
are rendered as line segments, controlled by the standard line
render properties lineColor and lineWidth, and the value
of directionRenderLen specifies the length of this segment
relative to the size of the element. - directionRenderType
-
If directionRenderLen
, this property specifics where the fibre directions should be rendered within muscle bundle
elements. The value ELEMENT causes a single direction to be
rendered at the element center, while INTEGRATION_POINT causes
directions to be rendered at each of the element’s integration points. - elementWidgetSize
-
A scalar in the range
, which if causes the elements
within a muscle bundle to be rendered using an element widget (Section
6.12.2).
Since these properties are inherited and exported by both FemMuscleModel and MuscleBundle, they can be set for the FEM muscle model as a whole or for individual muscle bundles.
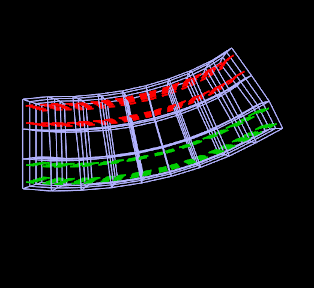
The code fragment below sets the element fibre directions for two muscle bundles to be drawn, one in red and one in green, using a directionRenderLen of 0.5. Each bundle runs horizontally along an FEM beam, one at the top and the other at the bottom (Figure 6.22, left):
By default, directionRenderType is set to ELEMENT and so directions are drawn at the element centers. Setting directionRenderType to INTEGRATION_POINT causes the directions to be drawn at each integration point (Figure 6.22, right), which is useful when directions are specified at integration points (Section 6.9.3).
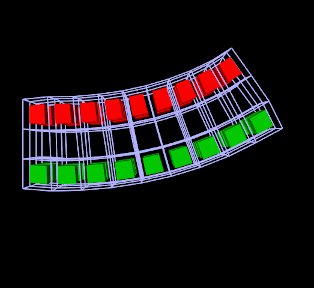
If we are only interested in seeing the elements associated with a muscle bundle, we can use its elementWidgetSize property to draw the elements as widgets (Figure 6.23, left). For this, the last two lines of the fragment above could be replaced with
Finally, if the muscle bundle contains point-to-point fibres (Section 6.9.2), these can be rendered by setting the line properties of the standard render properties. For example, the fibre rendering of Figure 6.23 (right) can be set up using the code

|

|
6.12.5 Color bars
To display values corresponding to colors, a ColorBar needs to be added to the RootModel. Color bars are general Renderable objects that are only used for visualizations. They are added to the display using the
method in RootModel. Color bars also have a ColorMap associated with it. The following functions are useful for controlling its visualization:
The normalized location specifies sizes relative to the screen size (1 = screen width/height). The location override, if values are non-zero, will override the normalized location, specifying values in absolute pixels. Negative values for position correspond to distances from the left/top. For instance,
will create a bar that is 10% up from the bottom of the screen, 40 pixels from the right edge, with a height occupying 80% of the screen, and width 20 pixels.
Note that the color bar is not associated with any mesh or finite element model. Any synchronization of colors and labels must be done manually by the developer. It is recommended to do this in the RootModel’s prerender(...) method, so that colors are updated every time the model’s rendering configuration changes.
6.12.6 Example: stress/strain plotting with color bars
The following model extends FemBeam to render stress, with an added color bar. The loaded model is shown in Figure 6.24.
6.12.7 Cut planes
In addition to stress/strain visualization on its meshes, FEM models can be supplied with one or more cut planes that allow stress or strain values to be visualized on the cross section of the model with the plane.
Cut plane components are implemented by FemCutPlane and can be created with the following constructors:
| FemCutPlane() |
Creates a cut plane aligned with the world origin. |
| FemCutPlane (double res) |
Creates an origin-aligned cut plane with grid resolution res. |
| FemCutPlane (RigidTransform3d TPW) |
Creates a cut plane with pose TPW. |
| FemCutPlane (double res, RigidTransform3d TPW) |
Creates a cut plane with pose TPW and grid resolution res. |
The pose and resolution are described further below. Once created, a cut plane can be added to an FEM model using its addCutPlane() method:
The FEM model methods for handling cut planes include:
| void addCutPlane(FemCutPlane cp) |
Adds a cut plane to the model. |
| int numCutPlanes() |
Queries number of cut planes in the model. |
| FemCutPlane getCutPlanes(int idx) |
Gets the idx-th cut plane in the model. |
| boolean removeCutPlane(FemCutPlane cp) |
Removes a cut plane from the model. |
| void clearCutPlanes() |
Removes all cut planes from the model. |
As with rigid and mesh bodies, the pose of the cut plane gives
its position and orientation relative to world coordinates and is
described by a RigidTransform3d. The
plane itself is aligned with the ![]() -
-![]() plane of this local coordinate
system. More specifically, if the pose is given by
plane of this local coordinate
system. More specifically, if the pose is given by ![]() such that
such that
| (6.38) |
then the plane passes through point ![]() and its normal is given
by the
and its normal is given
by the ![]() axis (third column) of
axis (third column) of ![]() . When rendered in the
viewer, FEM model stress/strain values are displayed as a color map
within the polygonal region formed by the intersection between the
plane and the model’s surface mesh.
. When rendered in the
viewer, FEM model stress/strain values are displayed as a color map
within the polygonal region formed by the intersection between the
plane and the model’s surface mesh.
The following properties of FemCutPlane are used to control how it is rendered in the viewer:
- squareSize
-
A double value, which if
specifies the size of a square that
shows the position of the plane. - resolution
-
A double value, which if
specifies an explicit size (in units
of distance) for the grid cells created within the FEM surface/plane
intersection to interpolate stress/strain values. Smaller values will
give more accurate results but may slow down the rendering
time. Accuracy will also not be improved if the resolution is
significantly less that the size of the FEM elements. If resolution  , the grid size is determined automatically based
on the element sizes.
, the grid size is determined automatically based
on the element sizes. - axisLength, axisDrawStyle
-
Identical in function to the axisLength and axisDrawStyle properties for rigid bodies (Section 3.2.8). Specifies the length and style for rendering the local coordinate frame of the cut plane.
- surfaceRendering
-
Describes what is rendered on the surface/plane intersection polygon, according to table 6.5.
- stressPlotRange, stressPlotRanging, colorMap
-
Identical in function to the stressPlotRange, stressPlotRanging and colorMap properties exported by FemModel3d and FemMeshComp (Section 6.12.3). Controls the range and color map associated with the surface rendering.
As with all properties, the values of the above can be accessed either in code using set/get accessors named after the property (e.g., setSurfaceRendering(), getSurfaceRendering()), or within the GUI by selecting the cut plane and then choosing Edit properties ... from the context menu.
6.12.8 Example: FEM model with a cut plane
Cut planes are illustrated by the application model defined in
artisynth.demos.tutorial.FemCutPlaneDemo
which creates a simple FEM model in the shape of a half-torus, and then adds a cut plane to render its internal stresses. Its build() method is given below:
After a MechModel is created (lines 27-29), an FEM model
consisting of a half-torus is created, with the bottom nodes set
non-dynamic to provide support (lines 31-43). A cut plane is then
created with a pose that centers it on the world origin and aligns it
with the world ![]() -
-![]() plane (lines 47-49). Surface rendering is set
to Stress, with a fixed color plot range of
plane (lines 47-49). Surface rendering is set
to Stress, with a fixed color plot range of ![]() (lines
52-54). A control panel is created to expose various properties of the
plane (lines 57-63), and then other rendering properties are set: the
default FEM line color is made white (line 67); to avoid visual
clutter FEM elements are made invisible and instead the FEM is
rendered using a wireframe representation of its surface mesh (lines
69-74); and in addition to its render surface, the cut plane is also
displayed using its coordinate axes (with length 0.08) and a square of
size 0.12 (lines 76-78).
(lines
52-54). A control panel is created to expose various properties of the
plane (lines 57-63), and then other rendering properties are set: the
default FEM line color is made white (line 67); to avoid visual
clutter FEM elements are made invisible and instead the FEM is
rendered using a wireframe representation of its surface mesh (lines
69-74); and in addition to its render surface, the cut plane is also
displayed using its coordinate axes (with length 0.08) and a square of
size 0.12 (lines 76-78).
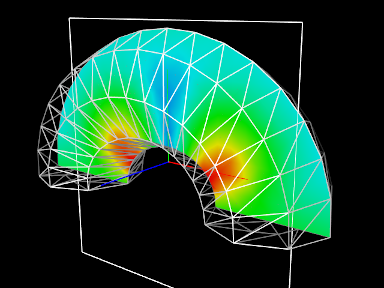
To run this example in ArtiSynth, select All demos > tutorial > FemCutPlaneDemo from the Models menu. When loaded and run, the model should appear as in Figure 6.25. The plane can be repositioned by selecting it in the viewer (by clicking on its square, coordinate axes, or render surface) and then using one of the transformer tools to change its position and/or orientation (see the section “Transformer Tools” in the ArtiSynth User Interface Guide).
![[LOGO]](data:image/png;base64,iVBORw0KGgoAAAANSUhEUgAAAAsAAAAOCAYAAAD5YeaVAAAAAXNSR0IArs4c6QAAAAZiS0dEAP8A/wD/oL2nkwAAAAlwSFlzAAALEwAACxMBAJqcGAAAAAd0SU1FB9wKExQZLWTEaOUAAAAddEVYdENvbW1lbnQAQ3JlYXRlZCB3aXRoIFRoZSBHSU1Q72QlbgAAAdpJREFUKM9tkL+L2nAARz9fPZNCKFapUn8kyI0e4iRHSR1Kb8ng0lJw6FYHFwv2LwhOpcWxTjeUunYqOmqd6hEoRDhtDWdA8ApRYsSUCDHNt5ul13vz4w0vWCgUnnEc975arX6ORqN3VqtVZbfbTQC4uEHANM3jSqXymFI6yWazP2KxWAXAL9zCUa1Wy2tXVxheKA9YNoR8Pt+aTqe4FVVVvz05O6MBhqUIBGk8Hn8HAOVy+T+XLJfLS4ZhTiRJgqIoVBRFIoric47jPnmeB1mW/9rr9ZpSSn3Lsmir1fJZlqWlUonKsvwWwD8ymc/nXwVBeLjf7xEKhdBut9Hr9WgmkyGEkJwsy5eHG5vN5g0AKIoCAEgkEkin0wQAfN9/cXPdheu6P33fBwB4ngcAcByHJpPJl+fn54mD3Gg0NrquXxeLRQAAwzAYj8cwTZPwPH9/sVg8PXweDAauqqr2cDjEer1GJBLBZDJBs9mE4zjwfZ85lAGg2+06hmGgXq+j3+/DsixYlgVN03a9Xu8jgCNCyIegIAgx13Vfd7vdu+FweG8YRkjXdWy329+dTgeSJD3ieZ7RNO0VAXAPwDEAO5VKndi2fWrb9jWl9Esul6PZbDY9Go1OZ7PZ9z/lyuD3OozU2wAAAABJRU5ErkJggg==)